Present Status of Well Being »
Health
Published: May 24, 2019 12:00 AM
a. Health Personnel and Facilities, Public and Private
San Jose City has a main health center located at the Poblacion, Brgy. R. Eugenio, manned by 5 local doctors/physicians, 7 nurses, 21 midwives, 4 dentists, 2 dental aides, 5 sanitary inspectors, 1 pharmacist and 2 medical technologist stationed at the main health center and 5 rural health units. (Calaocan RHU, Abar 1st RHU, Malasin RHU, Sto. Niņo 1st RHU and Palestina RHU). The city has two (2) hospitals; one government and one privately owned located in Barangay Malasin and Barangay R. Rueda, respectively. The San Jose City General Hospital (public) has 75-bed capacity while Sacred Heart of Jesus Hospital (private) has 61 bed capacity as of 2015. The city operates a City Health Panganakan which caters to the maternal lying in for normal child deliveries.
b. Ten (10) leading causes of Morbidity
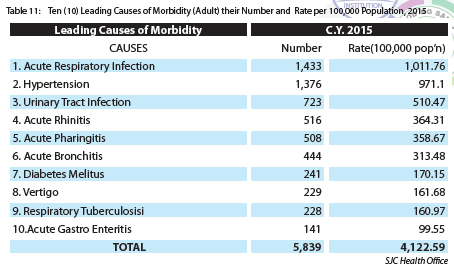
The two leading causes of morbidity on adults in 2015 are Acute Respiratory Infection and Hypertension (See Table 11). In 2014, the two leading causes of adult morbidity are Acute Respiratory Distress and Hypertension. Meanwhile, Acute Respiratory Infection and Acute Bronchitis are the leading causes of morbidity among children (See Table 12).
On the other hand, the two leading causes of morbidity on adults in 2015 are Acute Respiratory Infection and Hypertension (See Table 11). In 2014, the two leading causes of adult morbidity are Acute Respiratory Distress and Hypertension. Meanwhile, Acute Respiratory Infection and Acute Bronchitis are the leading causes of morbidity among children (See Table 12).
c. Ten (10)L leading causes of Mortality
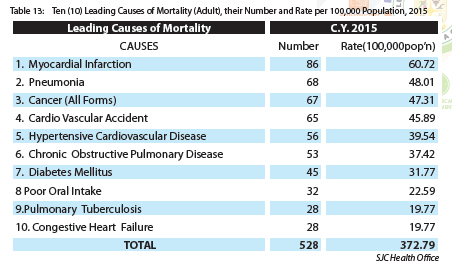
Based on the 2015 health statistics shown in Table 13, the two leading causes of death in the city are Myocardial Infarction and Pneumonia the same causes in year 2014.
Meanwhile, Bronchopneumonia and Dehydration are the leading causes of infant mortality.
d. Nutritional Status of Pre- Schoolers & Elementary School Pupils
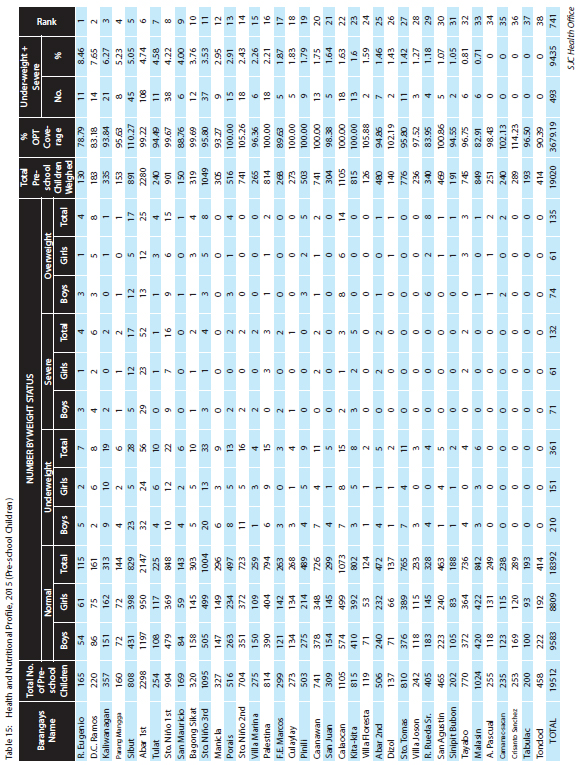
Based on the total of 19,020 (previous18,732 ) pre-school children (Table 15) weighed in 2015, 96.69% or 18,392 are considered normal, 1.89% or 361 underweight, and 0.69 % or 132 (previous,163) are severe while 0.69% or 132 are above normal.
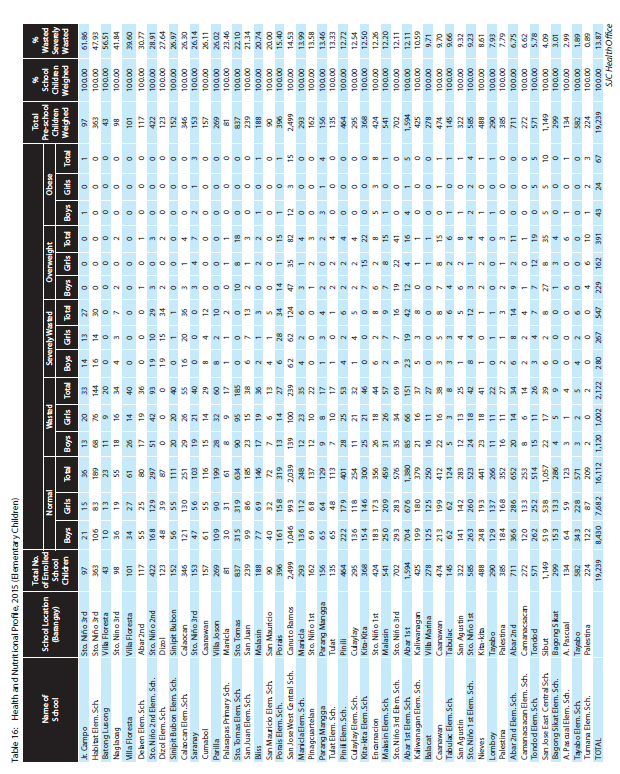
The nutritional status of elementary school children is represented in Table 16. It revealed that out of 19,239 (previous, 16,996) elementary school children weighed, 16,112 or 70.13% ( previous 82.92% or 14,093) are considered normal, 2,122 or 11.02% (previous, 10.77% or 1,830) are wasted, 547 or 2.84 previous, 3.77% or 641) are severely wasted), 391 or 0.22% ( previous, 2.21% or 375 ) elementary school children are overweight and 67 or 0.38% (previous, 0.33% or 57) are considered obese.
Furthermore, Barangay Raymundo Eugenio had the highest percentage of children with severe cases among pre-school level while Junior Campo Elementary School in barangay Sto. Nino 2nd registered highest percentage in elementary level.
The following tables (Tables 15 nd 16) reflect the number of children weighed in the total number of children both pre schoolers and elementary level which is averaging to 96.8% in year 2015.
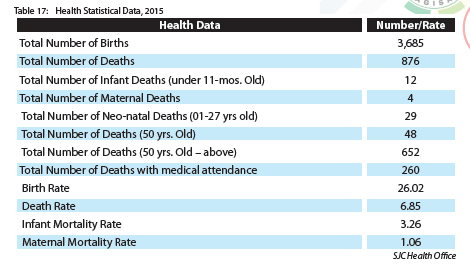
e. Other Health Statistical Data
The table below reflects other health data which reflects a total of 3,685 number of births in 2015 with a birth rate of 26.02.

